> ## Documentation Index
> Fetch the complete documentation index at: https://docs.novita.ai/llms.txt
> Use this file to discover all available pages before exploring further.
# Web Console
[Agent Sandbox console](https://novita.ai/zh/sandbox-console/view) helps you view and manage sandboxes, templates, and usage statistics.
## Sandbox Management
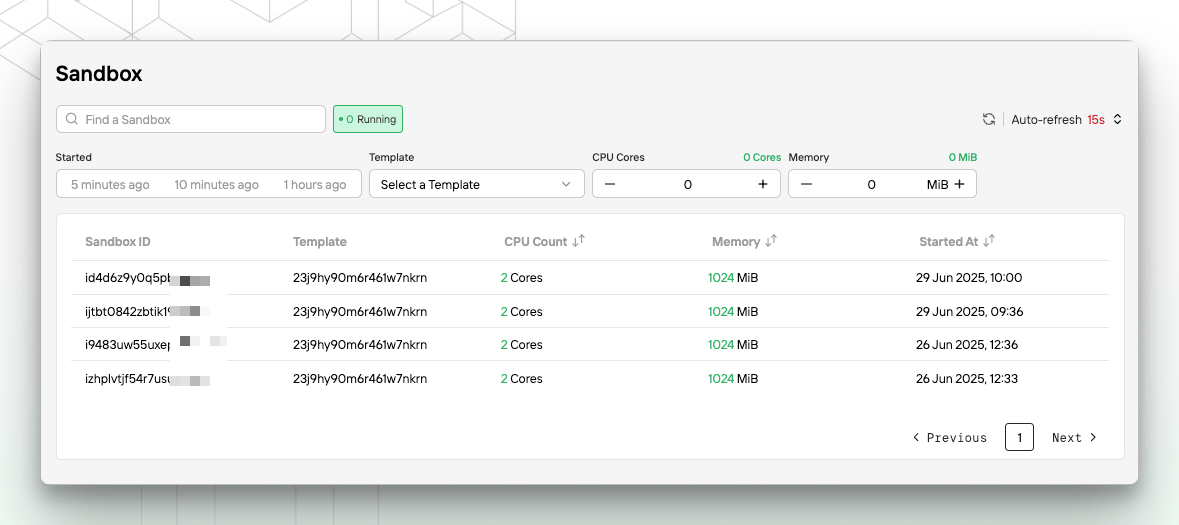
* View currently running sandboxes.
* Search for a sandbox by ID.
* Filter sandboxes by creation time, template, vCPUs, memory, and other attributes.
 ## Template Management
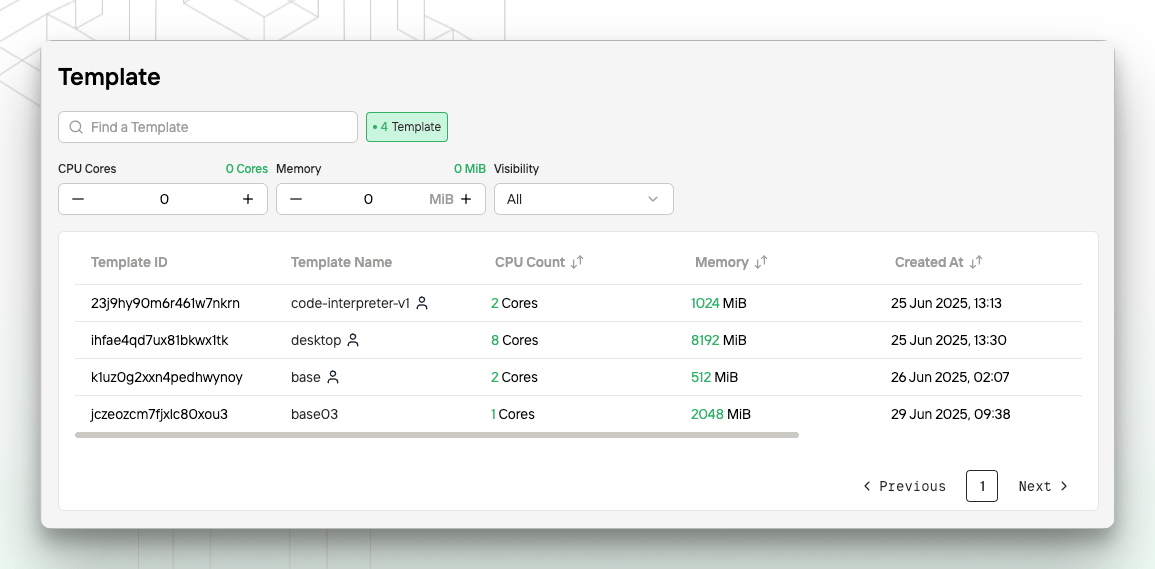
* Display the list of available templates, including official templates provided by Novita and your [custom templates](/guides/sandbox-template-build-operations).
* Support searching for a template by ID.
* Support filtering templates by visibility (public, private, or all), vCPUs, and memory.
## Template Management
* Display the list of available templates, including official templates provided by Novita and your [custom templates](/guides/sandbox-template-build-operations).
* Support searching for a template by ID.
* Support filtering templates by visibility (public, private, or all), vCPUs, and memory.
 ## Usage Statistics
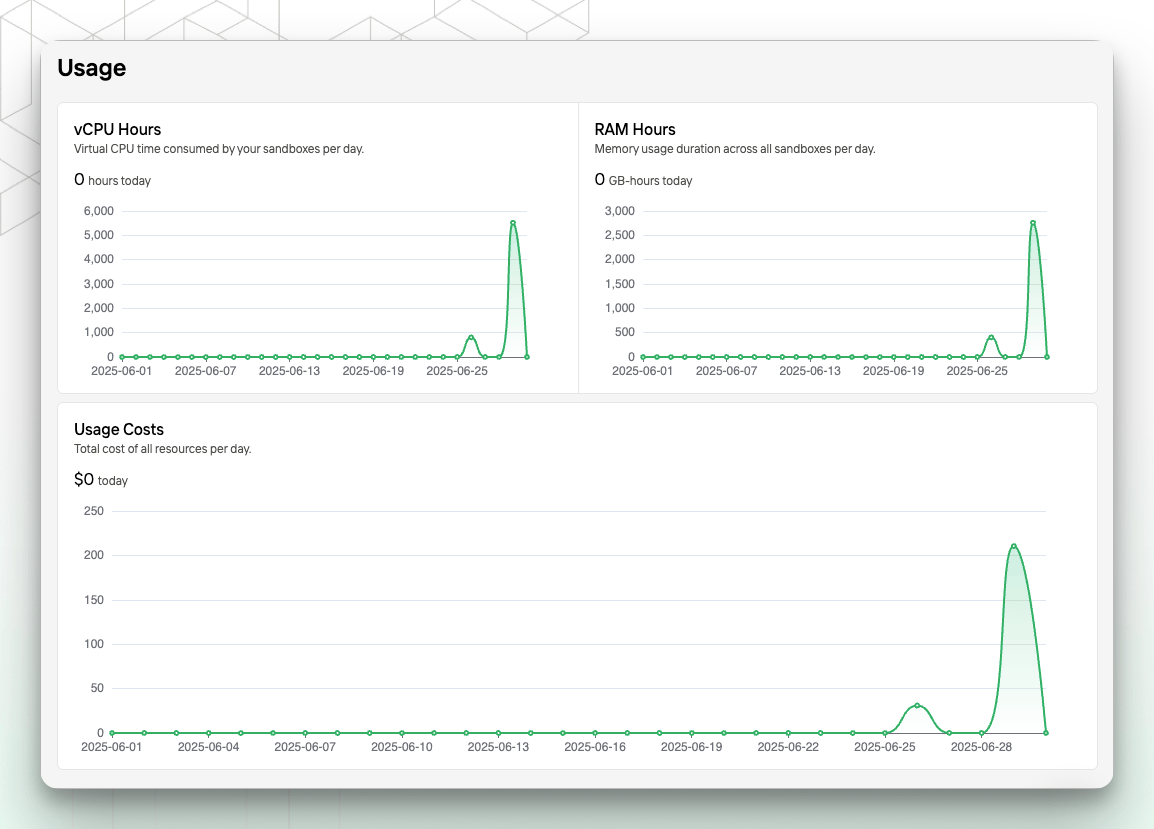
The console provides daily resource usage and cost analysis to help you monitor and optimize your consumption.
* **vCPU Hours**\
Displays the total vCPU runtime across all sandboxes for the current day (unit: hours).
* This data is calculated with second-level precision and can help you evaluate compute usage.
* **Memory Hours**\
Displays the total memory usage across all sandboxes for the current day (unit: GiB-hours).
* The system calculates this based on each sandbox's allocated memory and runtime.
* **Usage Costs**\
Displays the total resource cost for the current day (unit: USD).
* This includes vCPU and memory costs. For detailed billing rules, see [Pricing](/guides/sandbox-pricing).
* All resources are billed by the second and displayed at daily granularity.
* The chart shows usage trends over the past 30 days and can be used to monitor changes in resource consumption.
* Usage data may not include the most recent usage and may differ slightly from your final bill. Final charges are based on the [Billing Details](https://novita.ai/billing/details) page.
## Usage Statistics
The console provides daily resource usage and cost analysis to help you monitor and optimize your consumption.
* **vCPU Hours**\
Displays the total vCPU runtime across all sandboxes for the current day (unit: hours).
* This data is calculated with second-level precision and can help you evaluate compute usage.
* **Memory Hours**\
Displays the total memory usage across all sandboxes for the current day (unit: GiB-hours).
* The system calculates this based on each sandbox's allocated memory and runtime.
* **Usage Costs**\
Displays the total resource cost for the current day (unit: USD).
* This includes vCPU and memory costs. For detailed billing rules, see [Pricing](/guides/sandbox-pricing).
* All resources are billed by the second and displayed at daily granularity.
* The chart shows usage trends over the past 30 days and can be used to monitor changes in resource consumption.
* Usage data may not include the most recent usage and may differ slightly from your final bill. Final charges are based on the [Billing Details](https://novita.ai/billing/details) page.