

Configure your OTLP endpoint
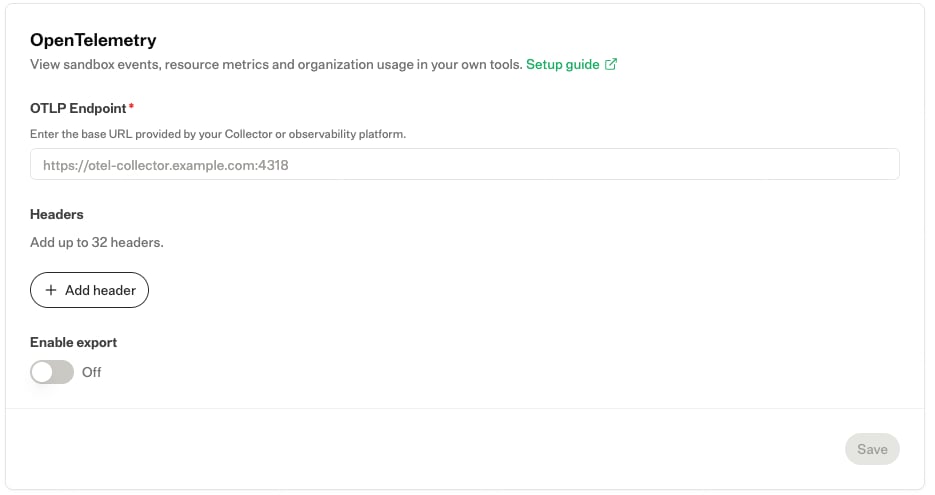
Open Sandbox Console Settings and find the OpenTelemetry section.- Enter the base URL provided by your OpenTelemetry Collector or observability platform in OTLP Endpoint.
- If your receiver requires authentication or other headers, add them under Headers. You can configure up to 32 headers.
- Turn on Enable export, then click Save.
Available telemetry
This page describes the available metrics and event information. To query data directly through the SDK or CLI instead, see Sandbox Metrics and Sandbox Events.
Resource attributes
Each resource contains these string attributes:
All metric names and business attributes below use the default
novita.sandbox. prefix. The prefix is determined by the service configuration.
Sandbox resource metrics
Resource metrics useservice.name = novita.sandbox.metrics. All six metrics are Gauges, representing values at the time of sampling. Each data point includes a sample timestamp.
CPU utilization is exported without multiplying or dividing by 100. Do not infer a 0–1 range from the unit
1 alone. Memory and disk metrics use the unit string MB, but their values are calculated from bytes divided by 1024² (MiB).Resource metric attributes
Each data point includes the following string attributes:
Use these attributes to filter by sandbox or compare resource usage across templates and regions. Memory utilization can be calculated as
mem_use_mb / mem_total_mb, and disk utilization as disk_use_mb / disk_total_mb, when the corresponding total is greater than zero.
Organization quotas and usage
Organization metrics useservice.name = novita.sandbox.organization. All metrics are Gauges with integer values. Each data point includes a collection timestamp.
Quotas
Current usage
Compare each concurrent usage metric with its corresponding limit to monitor remaining capacity. For details on sandbox limits, see Quota and Limits.
Organization metric attributes
Each data point includes the following string attributes:When an optional source value is missing, the sender omits the corresponding
limit.concurrent_cpu_core, limit.concurrent_mem_mb, or usage.concurrent_mem_mb data point. Do not treat an absent point as zero. Other metrics are still sent when their value is zero.Lifecycle events
Lifecycle events useservice.name = novita.sandbox.events and are exported as logs, not metrics. They describe sandbox lifecycle operations rather than command stdout or stderr. For command output, see Log Streaming.
Event information
Each event includes a timestamp, severity, message, and the attributes listed below.- Event time: When the event occurred. If the source timestamp is missing, the current time is used.
- Observed time: When the event batch was prepared for export.
- Severity:
ERRORwhen the state isfailor the HTTP status code is at least500; otherwiseINFO. The severity text contains the event state, such assuccessorfail. - Message:
sandbox lifecycle event: <event_name>.
Event attributes
Filter events by
sandbox_id to investigate a particular sandbox. Use event_name, state, status_code, and error_msg to identify failed operations, and latency_ms to inspect request latency.